Metro Fibre: Changing Times and Consolidation Opportunities

Eighteen years ago Wellingtonian Richard Naylor started a revolution in metropolitan area networks. Legend has it that under the cover of night he strung fibre optic cables along overhead trolley bus lines, linking City Council buildings with inexpensive Ethernet technology in order to break free of reliance on Telecom New Zealand. The resulting business, CityLink, became one of the world’s first “Open Access” fibre networks, offering Ethernet services not tied to any particular telecommunications provider. By its tenth birthday CityLink hit its stride, earning international recognition.

The CityLink model worked for Wellington, so around the time of that tenth birthday other non-telcos had decided to give it a go. Network Tasman built a fibre loop in Nelson, later expanding it to a regional network. Vector built a network in Auckland (where CityLink tried but failed to gain traction). And the list goes on:

These companies started facing a market where the incumbents were so expensive that competing with them was easy. They kicked in to high gear with the arrival of the Fifth National Government, and its promises of funding for metro and regional fibre networks right across the country. The upstarts built and lobbied and spent money on consultants and waged war in the media.

And then by 2011 it had all changed. The government engaged only three alternative networks to participate, along with Telecom and Vodafone, albeit with the condition that Telecom split out its infrastructure division into Chorus, an entirely separate company. The rest were left without a future.

UFB Business Fibre products are more consistent and far less expensive than incumbent products offered by these alternative providers – and they’re backed by large companies with real scale and support networks. Across the country Chorus has re-priced its existing business fibre at UFB pricing, meaning extra competition in the cities where an alternative provider is the UFB partner. And with Vodafone’s acquisition of TelstraClear and its extensive metro fibre holdings, the stage is set for fierce competition. By 2015 no rational corporate customer will be using fibre from alternative providers.

Is there hope for these alternative networks?

If you’re a service provider like CallPlus or FX Networks and owning your own fibre would reduce your OpEx, then some of these networks might look attractive to you. CityLink, for example, connects 450 buildings in Wellington. Over ten years you might spend $20M on access fees to those buildings. If you could acquire and operate CityLink over ten years for less than that, you’ve got a bargain.

If you’re 2Degrees, you have nearly 400 cellular towers in Vector’s coverage footprint. It would be reasonable to expect that number to treble with infill requirements. If you could acquire and operate Vector Fibre over ten years for less than $50M, it’s time to get out the chequebook.

While some of the smaller networks may never find suitors, and some like Inspire are already owned by vertically integrated service providers, expect to see consolidation in the market as existing networks fail to compete on their own but can provide value when bundled with larger operators.

NZ Radio Spectrum Landscape 2013

2012 brought significant change to New Zealand’s spectrum landscape in the form of multiple transactions involving radio spectrum management rights.

First, Vodafone and CallPlus entered in to a spectrum swap, converting two TDD blocks in the 2.5GHz range to FDD blocks compatible with UMTS Band VII.

Then Vodafone purchased TelstraClear, who held 150MHz of spectrum worth nearly $100 million dollars. As holding such a concentration of spectrum to the detriment of smaller players could be seen as a misuse of market power, Vodafone chose to leave some spectrum on the table in that deal. Telstra Australia then sold a 15MHz pair in Band III to 2Degrees shareholder Trilogy, and has kept a 5MHz pair in UMTS Band I.

The resulting spectrum landscape, detailed in the graphic below and in a downloadable wall chart, has increased the ability of both Vodafone and 2Degrees to deliver new and better services to New Zealand consumers.

In the chart, holdings of Telecom are shaded yellow, Vodafone orange, and 2degrees (including shareholders Hautaki and Trilogy) blue. The 700MHz Digital Dividend band likely to be auctioned in 2013 is shaded green. Common 3G/LTE cellular bands are noted to the right of relevant cellular holdings.

Download an A-series PDF wall chart for printing or easier on-screen viewing.

Spectrum Infographic Tall 2013-04-03 copy

LTE as Fibre Killer? Vodafone’s Quick Win for Fixed Mobile Substitution

Fixed Mobile Substitution (FMS) is the concept of replacing fixed telecommunications lines with mobile technologies.

In New Zealand the number of fixed lines in use has remained steady from 2006-2011. In Europe over the same period, the number of households without fixed lines increased from 18% to 27%. At the same time, penetration of broadband has increased in both markets.

High prices for data have kept New Zealand tied to its landlines for data while many Europeans have made the leap to all-mobile.

In support of high prices, New Zealand carriers have argued that spectrum is scarce, cellular equipment is expensive, and the cost of building towers is prohibitively expensive due to local councils and the Resource Management Act. As of this time last year all three carriers had the added operational expense of leasing fibre or Ethernet services to their towers for backhaul. These barriers have added up to networks that are generally running at capacity, with only high data costs to prevent users from overloading the network as in the case of Vodafone Australia.

All this changed in 2012 when Vodafone NZ made two strategic acquisitions. In May they performed a spectrum swap with CallPlus, converting what had been a fairly useless block of radio spectrum in to one compatible with a common variant of LTE. In October, the Commerce Commission approved their purchase of fixed-line carrier TelstraClear.

The TelstraClear purchase, in addition to bringing along a pile of radio spectrum, positions Vodafone as the only cellular carrier with their own metro fibre network. Vodafone has the added bonus of dense suburban reticulation through Christchurch and Wellington, in place to provide TV and broadband over a Hybrid Fibre Coax (HFC) system.

With metro fibre across most of New Zealand’s population and a new LTE network, Vodafone is positioned to be a strong competitor to UFB already. Their new LTE service using existing infrastructure is already twice the speed of the basic 30mbps UFB offering, but data pricing is being kept high to ward off network slowdowns. With a new fibre network and 2.6GHz spectrum, they could massively increase their network capacity without expensive equipment, tower builds, compliance costs, or backhaul OpEx using outdoor picocells. For example:

Pictures of four outdoor piocells installed
Alcatel-Lucent and Ericsson Outdoor Picocells enabling LTE coverage
  • Alcatel-Lucent’s MetroCell: A laptop-sized cell site designed to mount to a utility pole, requiring only 45 watts of power and IP backhaul and requiring no resource consent.
  • Alcatel-Lucent’s LightRadio: A distributed cellular architecture for 3G and LTE comprised of tiny, fibre backhauled cubes that are spread throughout an area on utility poles. They’re usable alone for low densities of users and stackable for higher densities.
  • Ericsson’s Bel-Air LTE Picocell: A laptop-sized LTE cell site that hangs from the same overhead coax lines that are used to provide cable TV – taking its power from the existing TV distribution network and using existing Ethernet services for backhaul.

All three can add an LTE sector of capacity to Vodafone’s network for less than $10k without new consents, tower leases, or backhaul costs. The Ericsson option could be rolled out to tens of thousands of customers in a matter of weeks. The combination of abundant spectrum, the ability to use cheap equipment, inexpensive or free access to utility poles as towers, and own-network metro backhaul are unique amongst New Zealand carriers.

Table comparing Vodafone, 2Degrees, and Telecom advantages
A Year Has Changed The Game

Using LTE picocells to provide increased network capacity, Vodafone could easily offer products in to the market with UFB equivalent speeds – without any of the startup costs or long-term contracts required for fibre installations. Given the savings over paying an LFC $37.50/month for a UFB circuit, shifting just 5% of the fixed broadband market on to an LTE solution could add an extra $26M p.a. to Vodafone’s bottom line.

LTE Picocells + New Spectrum + Metro Networks could be a quick win Vodafone, who now have the option of providing a “Fibre Killer” solution.

NZ NetIndex Ratings Skewed By Self Selection

Ookla’s Speedtest.Net is a popular and well-known test that allows home users to visit a website to measure the speed of their broadband connections. Results are provided to users as immediate feedback, and entered in to a database used by Ookla to provide country and ISP benchmarks available at www.netindex.com. Unfortunately by analysing the raw data behind Ookla’s NetIndex, NZTelco has found the index is not an accurate representation of broadband in New Zealand. In fact customers of small providers who have chosen to visit the site often have significantly skewed the results.

Ookla’s business is providing speed tests, and they are good at it. A number of technical articles in Ookla’s Blog explain the test methodology and rationale behind their test design. Ookla has a highly distributed system with a number of end points in New Zealand, and given ideal circumstances (user connected directly to their broadband modem, no backhaul congestion) Speedtest.Net results can be a good indication of how fast an end user’s connection can be.  It’s no surprise that Speedtest.Net results as below are often shown on websites like Geekzone.net or posted on Twitter.

A recent Speedtest.Net result
A recent Speedtest.Net result run by the author

It’s when these tests are recorded, aggregated, and presented as statistics characteristic of the broadband quality of a particular region or ISP that the good ends. For example, Ookla’s NetIndex rankings for Upload, Download, Quality, and Value are calculated on tests recorded in the last month. By these tests, New Zealand’s Download Speed Index is 10.47Mbps, and the country ranks 52nd in the world for Download Speed. On the Upload front, New Zealand’s index is 2.8Mbps, with a ranking of 62nd in the world for Upload Speed. As the NetIndex is calculated on a daily basis, today’s rankings have been captured below.

Download Index
Download Index
Upload Index
Upload Index

Browsing through the data of the NetIndex site provides an initial indication that the rankings and results provided by the Index may be inaccurate. Companies like TrustPower Ltd, Broadcast Communications Limited, and Rurallink LTD are listed as “Major ISPs” when in fact they account for a tiny percent of user in the New Zealand market. Results from niche players Vector, Voyager, Vibe, Fastcom, Netway, and EnterNet Online are given equal billing with major providers like Vodafone, Telecom, and TelstraClear.

Ookla has been an excellent corporate citizen and member of the Internet community by providing the world access to the raw data behind their index. On the 16th of January I downloaded and evaluated this data. My methodology involved extracting New Zealand results from a 2.4GB text file using Unix shell scripts, cleaning that data (combining results such as Vodafone Ltd and Vodafone New Zealand Ltd) using a data mining tool called OpenRefine, and then importing it into Google’s Fusion Tables cloud database. The resulting data set looked like the lines below:

New Zealand,NZ,Nelson,F5,Nelson,Snap Internet Limited,2013-01-06,34488.8,15285.4,238,129.839
New Zealand,NZ,Nelson,F5,Nelson,Snap Internet Limited,2013-01-07,34749.8,15311,228,130.828
New Zealand,NZ,Nelson,F5,Nelson,Snap Internet Limited,2013-01-09,35755.9,15353,216,131.182
New Zealand,NZ,Nelson,F5,Nelson,Snap Internet Limited,2013-01-10,36851.3,15153,217,131.862

Columns after the date above are averages of Download Speed, Upload Speed, Number of Tests used in Average, and Distance to Speedtest Server.

I then created two summaries of number of tests by ISP – one for the entire five year data set, and one for calendar year 2012. Ookla claims to have results from 1.2 million unique IP address in New Zealand. If these were a random sample of broadband users, by the Commerce Commission’s reckoning at least 49% (and up to 57%) of these tests would have been done on the Telecom New Zealand network. In fact in the five year data set Telecom only represented 31% of results, and in the 2012 tests only 26% of results. The chart below shows how Telecom is vastly under-represented and Orcon and other providers are vastly over-represented in the NetIndex.

Broadband Market Share by Data Source - Telco2 Ltd from Ookla NetIndex Data
Broadband Market Share by Data Source – Telco2 Ltd from Ookla NetIndex Data

Given the differing levels of investment in infrastructure and provision of bandwidth between Telecom and smaller providers, it is likely that the NetIndex rankings are significantly skewed, and should not be seen as a valid measure of Internet access speeds in New Zealand.

Cognitive Radio Should Be Priority #1 for RSM

RE: Consultation Draft – Radio Spectrum Five Year Outlook 2012-2016

Dear Minister,

I agree with the government’s goal of growing New Zealand’s economy and I am glad a link between effective radio spectrum management and New Zealand’s prosperity has been made in the introduction to MBIE’s Radio Spectrum Five Year Outlook 2012-2016.

Five years is a long time in the world of technology. In June of 2007, just five years ago, the first iPhone was released. The iPhone and its competitors have changed forever the way people interact with their phones and mobile data. This year, 3G smartphones are used by 50% of New Zealanders. Smartphones are poised to have a tremendous impact on New Zealand’s economy, with huge potential to streamline communications in the agriculture and tourism sectors.

In 2007 the most recent IEEE standards for 802.11 Wi-Fi allowed speeds up to 54mbps. This year the first 802.11ac Wi-Fi chipsets shipped to customers, at 867mbps. Due to light regulations and scarcity of spectrum, Wi-Fi devices are best in class when it comes to spectral efficiency and interference rejection, while having a lower cost per chipset than 3g/4g competitors. Wi-Fi is a part of almost every mobile device on the market, and is used daily at home and across all key industries. In the last five years, Wi-Fi has had an unquestionable impact on New Zealand’s economy.

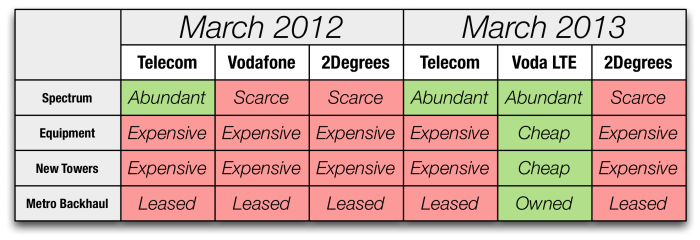
Five years has brought New Zealand a new mobile carrier, but one who operates with a fraction of the spectrum tied up by incumbent carriers, not all of whom use their spectrum. As a result of the entry of 2Degrees, the cost of mobile services has dropped precipitously, and New Zealand consumers and businesses are reaping the advantages of affordable mobility.

Smartphones, Wi-Fi, and a third cellular carrier have emerged notwithstanding Radio Spectrum Management policies, legislation or changes to those over the past five years. They have developed within the bounds of very small blocks of radio spectrum when compared to traditional uses such as radio and television uses. They have shown that they are extremely efficient users of the spectrum, but all would benefit from access to more spectrum, and more effective spectrum management.

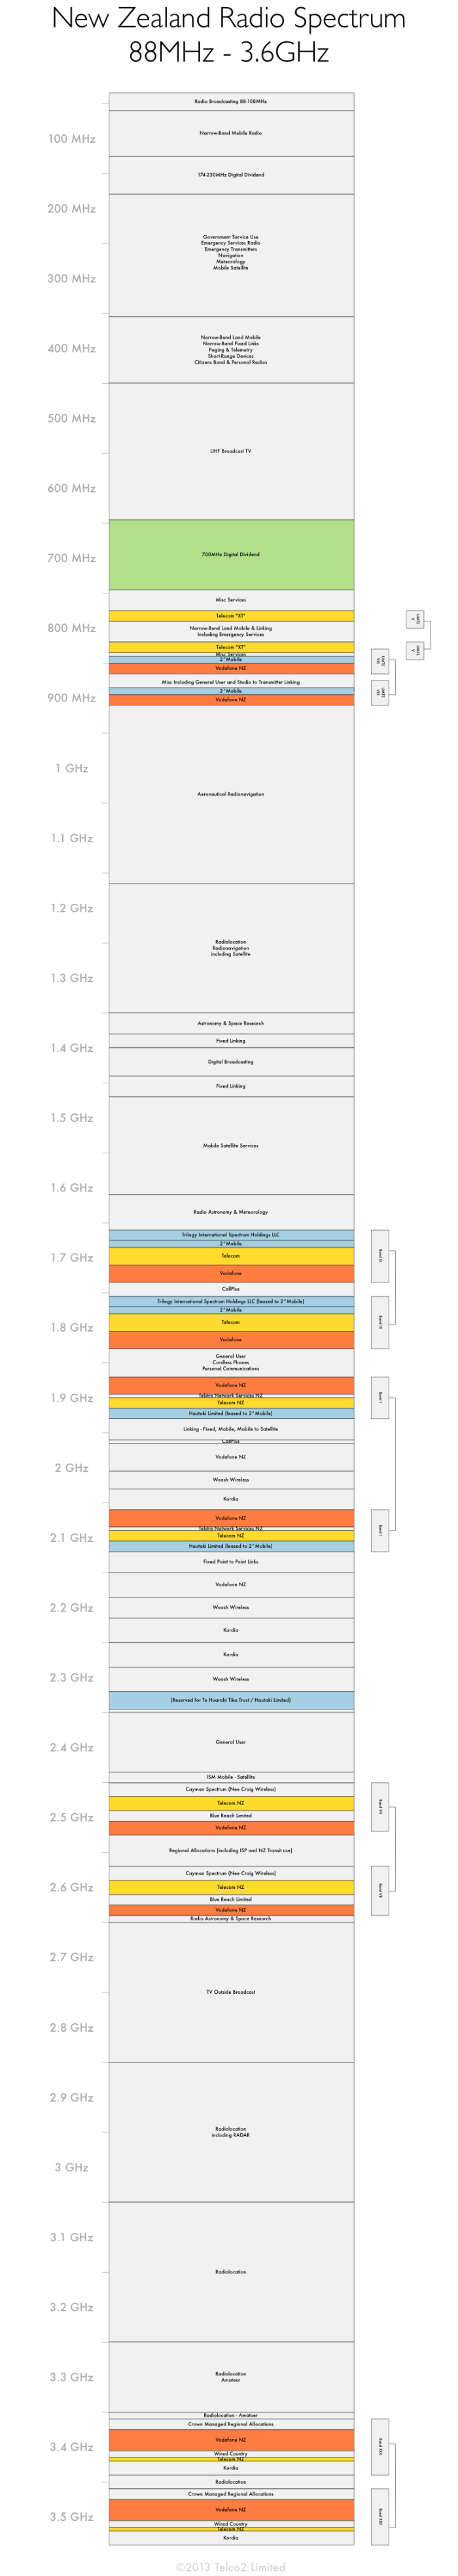
Measurements taken by University of Auckland researchers Chiang, Rowe, & Sowerby (2007) showed that in Auckland, arguably New Zealand’s busiest radio spectrum environment, real spectrum use in 806-2750MHz was only 6.2%. These measurements included all of the cellular and most popular broadband bands. Almost 94% of the New Zealand’s most valuable radio spectrum was quiet it its largest market. This is hardly effective management.

Taken in isolation, the UoA study might seem fantastic or flawed. Viewed in the context of studies around the world including the US and Singapore, some funded by the United States Defence Advanced Research Projects Agency, these measurements are unsurprising. It has been conclusively proven that traditional management techniques do not result in effective use of the radio spectrum.

Tradition, unfortunately, originates from New Zealand.

New Zealand’s pioneering approach to treat spectrum as a property right (based on the Torrens land title system) was based on a 1988 report by London consultancy NERA. Their work in turn was highly influenced by the ideas of Ronald Coase, who in a 1959 paper equated spectrum use to land use, and considered that users who would pay the most for exclusive rights to spectrum would put that spectrum to the best use.

It is unlikely that Coase or Charles Jackson, a key NERA consultant involved in writing the report, envisioned that treating spectrum as a property right would result in the massive inefficiencies we see in New Zealand today.

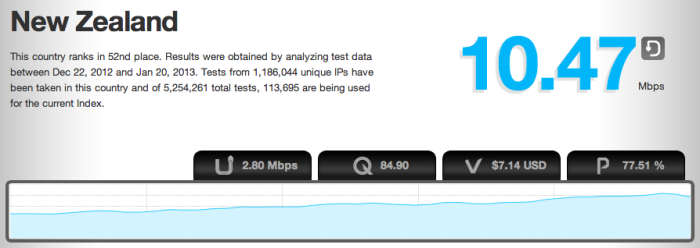
It has however happened. For a sum of money enough to block smaller competitors, some companies have locked up radio spectrum for years that would have a far greater impact on New Zealand’s economy if in use than the price they paid at auction. As a result of locking up the spectrum, these companies have been able to create an artificial scarcity. They have been able to use a limited amount of spectrum and equipment to provide services, while guaranteeing they were the only game in town. Resulting services and pricing, when compared to Australia or other OECD peers, has been poor for New Zealand.

The best result for the owner of the property has not aligned with growing New Zealand’s economy.

In the Five Year Outlook document, it’s stated that “the key operational objectives of spectrum management in New Zealand are to enable productive radio applications and minimise harmful interference between uses.” If this is the case, Radio Spectrum Management should be investigating ways of enabling productive radio applications as its highest priority – above asset management, documentation reviews, compliance projects, fee reviews, and above any legislative change that would further entrench the existing system of spectrum as an exclusive property right.

Section 4.1.3 of the Outlook document holds the key to efficient, productive, and full use of the radio spectrum. Cognitive radio technologies were created to take advantage of unused radio spectrum. They end the possibility of gaming the telecommunications market by purchasing and then not using radio spectrum. And while the Outlook assumes the technology is unlikely to develop within the next five years, the reality is cognitive radio is here and available today. Chipset manufacturers including Texas Instruments already offer DSP products capable of implementing cognitive radio (including IEEE 802 standards) and commercial cognitive radio networks are in use in the United States today.

The Outlook states of cognitive radio that “facilitation of the technology may require a radical departure from existing methods of spectrum regulation”. The time for a radical departure is now, and the concept that must be introduced to radio spectrum legislative and management frameworks is that of Primary and Secondary Use.

Primary Users have existing spectrum licenses which commonly allow for the right to transmit on a frequency and the right to have no harmful interference on that frequency. A primary user with a national management right could install transmitters around the country have interference-free operation everywhere they transmitted and everywhere their radio signals could reach. Their rights to offer a service would not be impeded upon.

Secondary Users are those with rights to transmit on frequencies only when their transmission would not affect a primary user, and with no protection from harmful interference on a particular frequency. Secondary Users can exist and thrive in areas where Primary Users cannot or will not, for either economic or technical reasons, use the spectrum they have licensed. Secondary use is an extremely good way of ensuring radio spectrum is used effectively.

The cognitive radio technologies now standardised by IEEE are advanced technologies that are capable of allowing safe coexistence of Primary and Secondary Users. They are likely to be adopted across all forms of radiocommunications, as innovative users meet with artificial spectrum shortages created by property rights based management and adapt to effectively communicate. In five years, cognitive radio products will not be an emerging technology, they will be a commonplace one.

The growth of New Zealand’s economy is linked to its ability to effectively communicate – not just with existing technologies, but with what’s next. Radio technology is changing faster than we can forecast on a five year time scale. We can’t reliably predict the next iPhone, Wi-Fi, or entrant into the New Zealand telecommunications market. We can predict that with so much of the world’s radio spectrum sold off but under-utilised, what’s next is likely to include cognitive radio.

The greatest impact Radio Spectrum Management could have on the economy is by ensuring management frameworks are ready for cognitive radio products. Such products will lead to greater, more efficient, lower cost communications, benefiting New Zealand in innumerable ways.

I thank you for this opportunity to comment on Radio Spectrum Management’s Consultation Draft – Radio Spectrum Five Year Outlook 2012-2016 and invite you to contact me if you have any questions regarding my submission.

Regards,

Jonathan Brewer

Television White Space for Rural Wireless Broadband

This week Telco2 (publisher of NZTelco) has released an InternetNZ-funded study of the practical application of Television White Space Broadband for use in rural New Zealand communities.

Television White Space Broadband (TVWS) is an inexpensive, light weight technology – priced closer to wireless broadband equipment than it is to the cellular equipment typically used to cover rural and remote communities. Through its use of television spectrum TVWS can allow broadband coverage far more effectively than technologies like Wi-Fi while emitting just four watts of power – orders of magnitude less than a typical cellular tower.

Using the technology, wireless broadband providers are now able to take advantage of unused television spectrum, while the rights of broadcasters are preserved. In the most straightforward example of TVWS use, if a television broadcaster isn’t using their spectrum in a particular area, and if its use for broadband wouldn’t compromise a broadcast elsewhere, that spectrum is available for use delivering wireless broadband in a dynamic yet controlled way.

To evaluate the potential utility of TVWS in New Zealand, three rural communities that will be missed by the RBI were identified and evaluated. Radio coverage models were constructed simulating common, off the shelf Wi-Fi technology and new TVWS equipment. The models were then compared for coverage potential of each technology – with TVWS broadband showing a clear advantage in some situations.

The full report is available online: http://tinyurl.com/bph5amf from InternetNZ.

Kordia’s Strategic Review

Kordia are undergoing a strategic review as reported by Computerworld. It’s about time. Kordia could have been the shared infrastructure company of New Zealand’s wireless ecosystem – as dominant and profitable player as Chorus is set to be on the fixed line side of things.

Instead of sticking to its core business of maintaining towers and transmission to a high standard, Kordia attempted to grab everything it could. Gallingly, in almost all the cases of their numerous commercial failures, they went head to head with their existing infrastructure and wholesale services customers instead of cooperating with them. And they did so with appalling personal and organizational arrogance.

The bigger failures:

  • Metro Wi-Fi network that didn’t meet the needs of its users
  • Rural wireless product that had massive functional issues
  • Metro wireless Ethernet product that was expensive and based on dated technology
  • The KorKor network – inferior coverage to TeamTalk and inferior technology to Telecom’s XT.
  • AIS network – too little, too late, and too expensive for many harbourmasters and port companies
  • OptiKor – might have done well but since handed off to Axin, a secretive shell company hiding secretive inves* tors
  • A strident bid for the government’s Rural Broadband Initiative that had them partner with Woosh and FX, which featured unbelievable technological claims

Aside from DTV (and remind me who paid for that) where have they headed in the right direction?

  • Offshore contracts – bringing cash back to NZ. Nice work.
  • OnKor Wide Area Network Services – a technically excellent product taking advantage of fibre rights held from the Clear days and a microwave network built to move television broadcasts around – complimentary to Orcon
  • Odyssey – control international transit and you can provide QoS to your customers – nice long term partner to Orcon
  • Orcon – a real competitor in the market, but are Kordia committed to it long term?

Keeping in mind that Onkor and Orcon compete against Kordia’s wholesale clients, and Odyssey is most useful as a part of that ecosystem, here’s some strategy:

1. Package Orcon, OnKor, and Odyssey up & divest them. Stop competing with the best potential customers of your huge (and maybe overvalued) asset base.

2. Go to Vodafone, Telecom, & 2degrees, JDA, local councils, and other tower owners, hat in hand, and say “hey guys, we know we screwed this up a few years ago, but from now on how about we start working together on tower and transmission infrastructure. Oh, and LTE with its 700MHz rural towers and high density 2500MHz urban microcell requirements might be a great time to start”

That would be a good day for Kordia, and its owners, the people of New Zealand.