New Zealand ISP Market: Q3 2015

The graphic below is an estimate of the state of New Zealand’s Internet Service Provider market as at Q3 2015. As with the Q1 2015 Estimate below, it draws on public information from Statistics New Zealand (Stats) and the Asia Pacific Network Information Centre (APNIC). This survey also considers Internet data from Internet backbone provider Hurricane Electric. The methodology of this estimate has changed significantly since the last published report – notes on the estimate’s production follow the graphic.

rankings_image

Stats published their latest annual ISP Survey in October 2014. It covers 1.98 million Internet connections from 85 Internet Service Providers, and characterises ISPs by size bands. Additional data requested by Telco2 cited mean and median subscriber count for all but the largest ISP size band.

APNIC has served tens of millions of google ads to the world to help determine the penetration of IPv6. The advertisements have special code that connects to APNIC servers and reports number of technical parameters, and test results include the client’s Autonomous System Name (ASN). APNIC’s data set has changed since Q1 2015, in that there are far more samples, but statistically insignificant measurements have been eliminated. This removes many “small” and all “very small” ISPs from the data set.

To provide a ranking and market estimate, I first normalised APNIC’s data set and recoded a number of data points to take into account recent mergers and acquisitions. While in Q1 I eliminated end user ASNs (including universities and large corporations), in Q3 I used BGP data from Hurricane Electric to determine the ISPs of these large users, and proportionally assigned market share to their ISPs. This brings new ISP into the survey: REANNZ. It also results in significant increases in market share for 2degrees, Vocus, Voyager, Kordia, Vector, and Solarix.

New Zealand ISP Market: Q1 2015

The graphic below provides an estimate of the state of New Zealand’s Internet Service Provider market as at Q1 2015. Public information from Statistics New Zealand (Stats) and the Asia Pacific Network Information Centre (APNIC) was used to speculate on the market share of all but the smallest providers. Notes on the methodology follow the graphic.

*** Note 19 Feb 2015 – Update: Added Vocus (Maxnet), Solarix. Changed Velocity to VelocityNet ***

isp_market

Stats published their latest annual ISP Survey in October 2014. It covers 1.98 million Internet connections from 85 Internet Service Providers, and characterises ISPs by size bands. Additional data requested by Telco2 cited mean and median subscriber count for all but the largest ISP size band.

APNIC has served over 57 million google ads to the world to help determine the penetration of IPv6. The advertisements have special code that connects to APNIC servers and reports number of technical parameters, and test results include the client’s Autonomous System Name (ASN).

To provide a ranking and market estimate, I normalised APNIC’s data set and recoded a number of data points to take into account recent mergers and acquisitions. I then determined market share using ISP survey data from Statistics, and classified providers into bands. Spot checks of mean subscriber totals per band as reported by Statistics against APNIC’s data indicate a good degree of correlation.

Broadband Affordability in New Zealand

The ITU/UNESCO Broadband Commission for Digital Development finds that in many economies broadband access costs less than 2% of an average household’s income. In 2011 they set a “global broadband affordability target” to encourage ITU members to bring the cost of broadband to under 5% of average income by 2015.

This map evaluates how New Zealand meets the ITU’s broadband affordability target. Addresses on the map are shaded from green to red in 1% steps. The darkest green dots show addresses where a median income household would pay up to 1% of their income for broadband. Red dots show addresses where a median income household would pay 5% or more. Hovering over a dot will indicate what broadband products are available at that address.

map-cap

A  paper on broadband affordability is available from Telco2 discussing the methodology and providing summary results.

ComCom’s 19GB/Month Broadband Use Claim

The Commerce Commission has published an annual report on the state of the telecommunications industry since 2008. The report, which is issued each year in March or April, publishes data collected from operators from a period ending around a year before publication. The April 2013 report, for example, covers the period between July 1 2011 and June 30 2012.

One of the key indicators reported is how much traffic home users consume in a month, and this year it was a surprise.

The amount of traffic used by a residential broadband subscriber in a month can be used to compare New Zealand’s participation in the Internet against that of other countries. It can also be used to determine whether broadband plans and penalties in the market are meeting the demand of the average user. It’s especially important this year, as we enter into a review of the Telecommunications Service Obligations, which may well see Universal Access for broadband replace older obligations such as unlimited local calling and the right to a phone line that supports fax and dial-up Internet.

For the 2010-2011 reporting period, the Commission reported “the average fixed line broadband subscriber is using around 10GB of data per month”, and that this was an increase from the previous year’s report of 7.5GB. This shows a 33.3% increase, which is coincidentally close to the 34% Compound Annual Growth Rate seen across the world as reported by Cisco’s Visual Networking Index.

The growth rate was further reinforced by Cisco’s Dr. Brian Pepper, who in a Commission sponsored conference reported that at the end of 2011 the average New Zealander was using 12GB/month of traffic – a 17% increase over the six months from the end of June 2011.

Given the data points and international trends, we would expect to see figures like this (reported figures in bold, others extrapolated):

2009-06 2009-12 2010-06 2010-12 2011-06 2011-12 2012-06 2012-12 2013-06
5.5 6.5 7.5 9 10 12.0 14.0 16.5 19

The expectation given these trends is that by June of 2012 we’d be up to nearly 14GB/month – not far off from the 16GB/month estimated by Statistics New Zealand and based on reports from end users on their own consumption.

The Commission however in the executive summary of their 2012 report states “Fixed broadband data use also doubled in the last year with the average amount of data traffic per user now at 19GB.” That’s a huge jump, and a dubious claim. Nothing significant occurred in the market to bring about a doubling in traffic utilisation.

Later in the report, footnote 8 on page 24 states “The Commission moved from collecting an average broadband data use figure from respondents to collecting total data broadband data sold by respondents, which was used to calculate an average.” And there’s our answer. Nothing significant did occur – just a major change in reporting.

Why would the Commission move away from using a recognised figure to a measure of how much data is sold by carriers?

I call on the Commerce Commission to publish actual use figures as at the end of June 2012 and to return to publishing actual use figures in future reports, so that the industry and users can have a consistent and realistic benchmark to work with.

Sending Party Pays for Bridging the Digital Divide

While many New Zealanders are considering the jump from copper to fibre broadband, many more aren’t considering either. It’s not that they don’t want broadband for themselves or their children, it’s because they can’t afford it.

In a report published in April, Statistics New Zealand estimated that 331,000 households don’t have broadband Internet access. A third of those households cite cost as the main reason. More troubling is that 63,000 households with dependent children don’t have access to the Internet because of cost.

Statistics also noted that 215,000 households don’t have landlines, but didn’t break down the reasons behind this. In Australia, 40% of mobile only households cited cost as the reason for not maintaining a fixed line. Going mobile only can be a huge cost saver if all you want to do is call and text. If New Zealand follows the lead of the European Union, soon up to 27% of households will be mobile only, and for many of those households cost will be the reason.

Prepay mobile and text are an amazing, inexpensive enabler of communications, and they’re easy to understand. Text messages and minutes have a cost. Sometimes in-network minutes cost less, but there’s a finite set of variables at play. On a monthly basis, prepay is usually cheaper than keeping up payments on a fixed line – and unlike fixed lines, prepay mobiles still receive calls and texts for months when you’re out of credit.

Prepay mobile data is an entirely different beast. It is far more expensive than fixed-line data, and comes in far smaller allocations. It’s allocated in bytes, not minutes, and it can be hard even for technical users to understand how bytes are getting spent. A simple mistake like allowing Windows Update to run over mobile data could see a data cap meant to last a month gone in minutes.

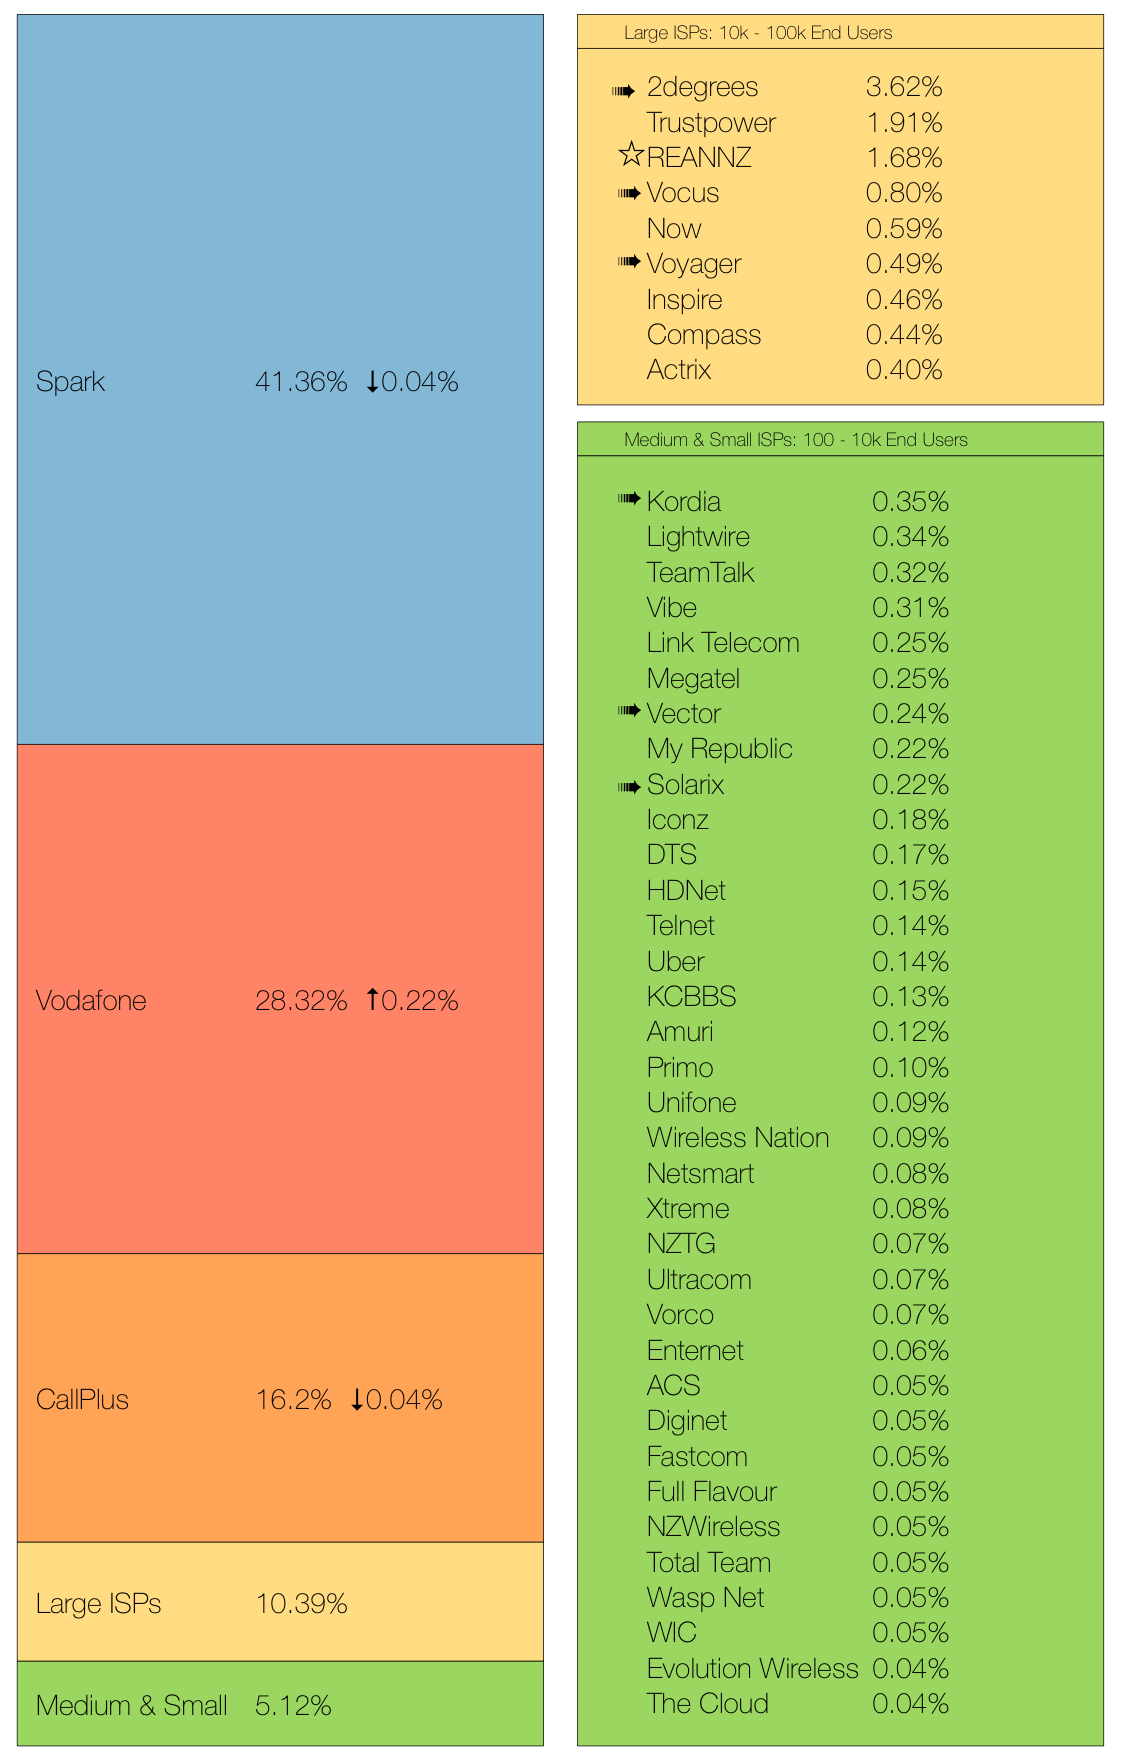
It’s true that mobile data is more expensive to provide than fixed-line data, though in New Zealand some of this expense comes from government policies around the sale of radio spectrum and carriers’ abilities to build radio towers. Other factors include New Zealand’s low population density. The end result is that prepay mobile data on Telecom’s and Vodafone’s national networks can be 50x more expensive than data on their fixed line networks.

It’s also true that the amount of mobile data required to perform most day to day tasks on the Internet is vanishingly small, and using the mobile web can be surprisingly inexpensive. For less than the standard cost of a prepay text message, you could check your balance on a mobile-optimised online banking website, download a Charles Dickens novel from Project Gutenberg, and have an entire conversation via Facebook Messenger.

The cost of optimised mobile data is so small that when Amazon sell a 3G-enabled Kindle, they include free 3G data for life, worldwide. Take your Kindle anywhere and the cost of browsing their store or downloading a new book is zero. Want to Tweet that you’ve finished a book? That’s free too. Similarly, Facebook have launched a product in many countries called “Facebook Zero”, where all mobile data traffic associated with viewing and posting status updates (but not watching movies) on a special Facebook page is free.

Even though only a small amount of data is required for many important Internet tasks, if you’ve blown your data cap watching a YouTube video or listening to streaming music, you’re out of luck until you can afford to top up your account again – and if your child needs the Internet for schoolwork, they’re out of luck too. Such situations result in the worst kind of social exclusion, and only serve to widen the digital divide.

This is a solvable problem, and a solution can be had without new legislation or regulation of the telecommunications industry. Amazon and Kindle have shown us that there is a market mechanism for providing free mobile data to end users: Sending Party Pays.

The idea of Sending Party Pays (SPP) has been around since the days of the Penny Post, and was the standard medium of business communication for the hundreds of years before the advent of the Internet. It allows businesses and government to directly pay carriers to communicate with customers or constituents who might not otherwise have the desire or means to pay for such communications. It further provides an incentive for senders to be concise and efficient with communications, both in terms of quality and quantity. It’s a proven model that needs to be extended into the digital age.

I call on government to commit to offering mobile-optimised versions of all government, social services, National Library, and Network4Learning resources in a Sending Party Pays arrangement with mobile carriers. Every New Zealander with a working SIM card should be able to access such services no matter their financial situations. Given the low transactional costs possible with 3G data, for a few million dollars a year we could make sure no one is excluded from a digital revolution that should be raising up all members of our society.

There will always be a place for requester pays content. In the present business model, all mobile web content is the equivalent of an 0900 call on a landline. When it comes to socially beneficially information, that’s not right. Uploading party pictures or watching the latest viral video shouldn’t be free, but everyone should be able to access education, health care, social services, and government resources for free, and as a society we should be providing this access in the easiest, most efficient manner possible.

If you want to discuss the policies, commercial mechanics, or the technologies that would enable a broad move to the provision of Sending Party Pays 3G data, come to NetHui in Wellington this July and let’s get on with ensuring Internet services are accessible for all New Zealanders.

Kordia Sale to Woosh: Spectrum Management Failure

Radio spectrum in the 2.3-2.5GHz bands is best known for use with broadband. It is the 2.4GHz “Public Park” that millions of New Zealanders use on a daily basis for Wi-Fi, Bluetooth, and other wireless data applications.

In 2007 when the sale of this broadband spectrum on both sides of the public band was contemplated, the Government of the day was worried about competition and the efficient use of the spectrum.

Cabinet has indicated a preference for strict acquisition limits and use-it-or-lose it provisions, in order to prevent spectrum hoarding and to facilitate the development over time of strong competitive conditions.” (Discussion Paper)

40MHz was set aside for regional providers while around 200MHz was put up for auction as national rights – with individual acquisition caps of 40MHz. Lots were sold at an average of $23k/MHz across the band, to a small list of New Zealand companies and one overseas investor – a subsidiary of Canada’s Craig Wireless.

Screen Shot 2013-04-17 at 10.32.39 AM
Coming up on six years later, none of the national spectrum rights are in widespread use. CallPlus subsidiary Blue Reach deployed a small WiMAX system in Auckland around the time of the Rugby World Cup, but has since swapped spectrum with Vodafone, necessitating a change in technology. Vodafone has not publicly expressed interest in using the spectrum, however a business case exists.

Meanwhile, the small bits of regional spectrum are in huge demand by operators who actually use it, but didn’t have the cash up front to participate in the auction process. In some parts of the country fights over use of that regional spectrum have become underhanded and acrimonious.

In 2011 a struggling Woosh was sold to Craig Wireless, erasing more than $100M in shareholder value. With government approval, that deal allowed Craig to take control of Woosh spectrum, bringing their holdings in the 2.3-2.5GHz band up to 70MHz.

Screen Shot 2013-04-17 at 10.32.47 AM

This week the landscape changed again, with government-owned Kordia selling its 2.3GHz rights to Woosh owner Craig, concentrating 45% of the national rights in the hands of Craig Wireless – a company unlikely to build in New Zealand as it struggles with a cash haemorrhaging local subsidiary and against a forceable de-listing from the Toronto Stock Exchange.

Screen Shot 2013-04-17 at 10.32.54 AM

The government’s policy of treating radio spectrum as a tradable property right has once again failed to bring a benefit to New Zealand. In the manner of Esau, the government has sold its birthright for a bowl of lentils. Now while homegrown providers like Araneo, Inspire, and Netsmart fight over regional crumbs yet deliver astounding benefits to rural New Zealand, an opportunist Jacob in the form of Craig Wireless has accumulated more and more unnecessarily fallow national spectrum.

Without significant change in radio spectrum management policy, New Zealand is destined to see the story above played out again and again, to the detriment of its people and industries.

Metro Fibre: Changing Times and Consolidation Opportunities

Eighteen years ago Wellingtonian Richard Naylor started a revolution in metropolitan area networks. Legend has it that under the cover of night he strung fibre optic cables along overhead trolley bus lines, linking City Council buildings with inexpensive Ethernet technology in order to break free of reliance on Telecom New Zealand. The resulting business, CityLink, became one of the world’s first “Open Access” fibre networks, offering Ethernet services not tied to any particular telecommunications provider. By its tenth birthday CityLink hit its stride, earning international recognition.

The CityLink model worked for Wellington, so around the time of that tenth birthday other non-telcos had decided to give it a go. Network Tasman built a fibre loop in Nelson, later expanding it to a regional network. Vector built a network in Auckland (where CityLink tried but failed to gain traction). And the list goes on:

These companies started facing a market where the incumbents were so expensive that competing with them was easy. They kicked in to high gear with the arrival of the Fifth National Government, and its promises of funding for metro and regional fibre networks right across the country. The upstarts built and lobbied and spent money on consultants and waged war in the media.

And then by 2011 it had all changed. The government engaged only three alternative networks to participate, along with Telecom and Vodafone, albeit with the condition that Telecom split out its infrastructure division into Chorus, an entirely separate company. The rest were left without a future.

UFB Business Fibre products are more consistent and far less expensive than incumbent products offered by these alternative providers – and they’re backed by large companies with real scale and support networks. Across the country Chorus has re-priced its existing business fibre at UFB pricing, meaning extra competition in the cities where an alternative provider is the UFB partner. And with Vodafone’s acquisition of TelstraClear and its extensive metro fibre holdings, the stage is set for fierce competition. By 2015 no rational corporate customer will be using fibre from alternative providers.

Is there hope for these alternative networks?

If you’re a service provider like CallPlus or FX Networks and owning your own fibre would reduce your OpEx, then some of these networks might look attractive to you. CityLink, for example, connects 450 buildings in Wellington. Over ten years you might spend $20M on access fees to those buildings. If you could acquire and operate CityLink over ten years for less than that, you’ve got a bargain.

If you’re 2Degrees, you have nearly 400 cellular towers in Vector’s coverage footprint. It would be reasonable to expect that number to treble with infill requirements. If you could acquire and operate Vector Fibre over ten years for less than $50M, it’s time to get out the chequebook.

While some of the smaller networks may never find suitors, and some like Inspire are already owned by vertically integrated service providers, expect to see consolidation in the market as existing networks fail to compete on their own but can provide value when bundled with larger operators.