Ookla’s Speedtest.Net is a popular and well-known test that allows home users to visit a website to measure the speed of their broadband connections. Results are provided to users as immediate feedback, and entered in to a database used by Ookla to provide country and ISP benchmarks available at www.netindex.com. Unfortunately by analysing the raw data behind Ookla’s NetIndex, NZTelco has found the index is not an accurate representation of broadband in New Zealand. In fact customers of small providers who have chosen to visit the site often have significantly skewed the results.
Ookla’s business is providing speed tests, and they are good at it. A number of technical articles in Ookla’s Blog explain the test methodology and rationale behind their test design. Ookla has a highly distributed system with a number of end points in New Zealand, and given ideal circumstances (user connected directly to their broadband modem, no backhaul congestion) Speedtest.Net results can be a good indication of how fast an end user’s connection can be. It’s no surprise that Speedtest.Net results as below are often shown on websites like Geekzone.net or posted on Twitter.

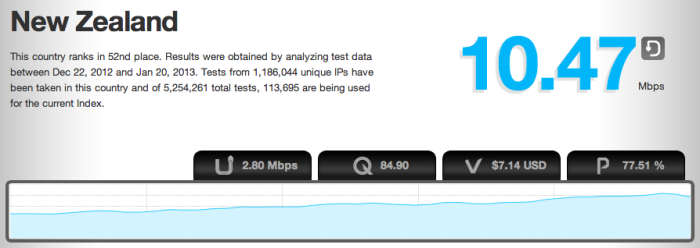
It’s when these tests are recorded, aggregated, and presented as statistics characteristic of the broadband quality of a particular region or ISP that the good ends. For example, Ookla’s NetIndex rankings for Upload, Download, Quality, and Value are calculated on tests recorded in the last month. By these tests, New Zealand’s Download Speed Index is 10.47Mbps, and the country ranks 52nd in the world for Download Speed. On the Upload front, New Zealand’s index is 2.8Mbps, with a ranking of 62nd in the world for Upload Speed. As the NetIndex is calculated on a daily basis, today’s rankings have been captured below.

Browsing through the data of the NetIndex site provides an initial indication that the rankings and results provided by the Index may be inaccurate. Companies like TrustPower Ltd, Broadcast Communications Limited, and Rurallink LTD are listed as “Major ISPs” when in fact they account for a tiny percent of user in the New Zealand market. Results from niche players Vector, Voyager, Vibe, Fastcom, Netway, and EnterNet Online are given equal billing with major providers like Vodafone, Telecom, and TelstraClear.
Ookla has been an excellent corporate citizen and member of the Internet community by providing the world access to the raw data behind their index. On the 16th of January I downloaded and evaluated this data. My methodology involved extracting New Zealand results from a 2.4GB text file using Unix shell scripts, cleaning that data (combining results such as Vodafone Ltd and Vodafone New Zealand Ltd) using a data mining tool called OpenRefine, and then importing it into Google’s Fusion Tables cloud database. The resulting data set looked like the lines below:
New Zealand,NZ,Nelson,F5,Nelson,Snap Internet Limited,2013-01-06,34488.8,15285.4,238,129.839
New Zealand,NZ,Nelson,F5,Nelson,Snap Internet Limited,2013-01-07,34749.8,15311,228,130.828
New Zealand,NZ,Nelson,F5,Nelson,Snap Internet Limited,2013-01-09,35755.9,15353,216,131.182
New Zealand,NZ,Nelson,F5,Nelson,Snap Internet Limited,2013-01-10,36851.3,15153,217,131.862
Columns after the date above are averages of Download Speed, Upload Speed, Number of Tests used in Average, and Distance to Speedtest Server.
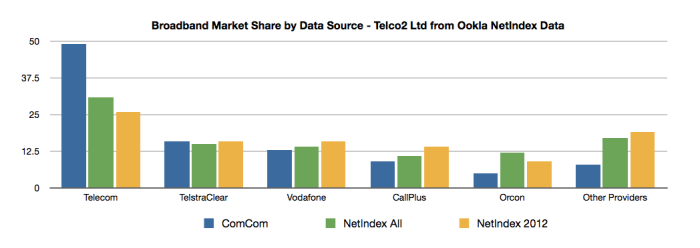
I then created two summaries of number of tests by ISP – one for the entire five year data set, and one for calendar year 2012. Ookla claims to have results from 1.2 million unique IP address in New Zealand. If these were a random sample of broadband users, by the Commerce Commission’s reckoning at least 49% (and up to 57%) of these tests would have been done on the Telecom New Zealand network. In fact in the five year data set Telecom only represented 31% of results, and in the 2012 tests only 26% of results. The chart below shows how Telecom is vastly under-represented and Orcon and other providers are vastly over-represented in the NetIndex.
Given the differing levels of investment in infrastructure and provision of bandwidth between Telecom and smaller providers, it is likely that the NetIndex rankings are significantly skewed, and should not be seen as a valid measure of Internet access speeds in New Zealand.
